用VSCode debug Sketchup的几点注意事项
用VSCode开发Sketchup的Ruby插件,设置debug环境。主要步骤可以跟着官方的参考文档来:
另外还有一篇中文的文章《用vscode调试ruby 和 ruby for Sketchup》也可供参考
但今天在摸索的过程中,还是遇到一些问题,特将解决过程记录如下:
一、配置Task时,SketchUp.exe的路径及参数
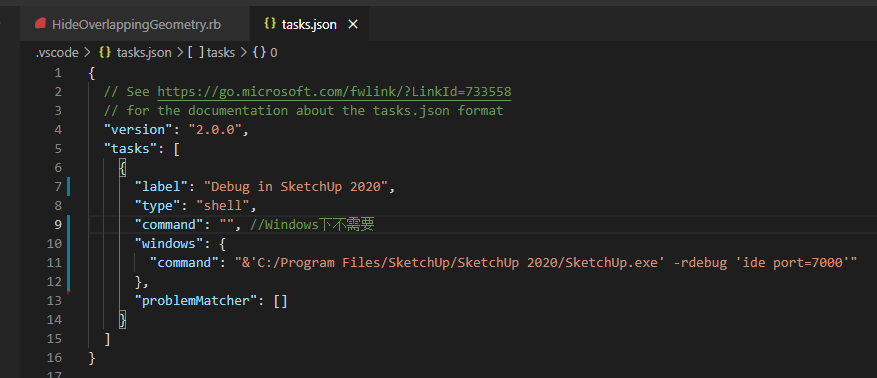
开始按照官方文档,配置task.json如下:
{
  // See https://go.microsoft.com/fwlink/?LinkId=733558
  // for the documentation about the tasks.json format
  "version": "2.0.0",
  "tasks": [
    {
      "label": "Debug in SketchUp 2020",
      "type": "shell",
      "command": "", //Windows下不需要
      "windows": {
        "command": "&'C:/Program Files/SketchUp/SketchUp 2020/SketchUp.exe' -rdebug 'ide port=7000'"
      },
      "problemMatcher": []
    }
  ]
}
但实际运行时,要么报
此时不应有 &。
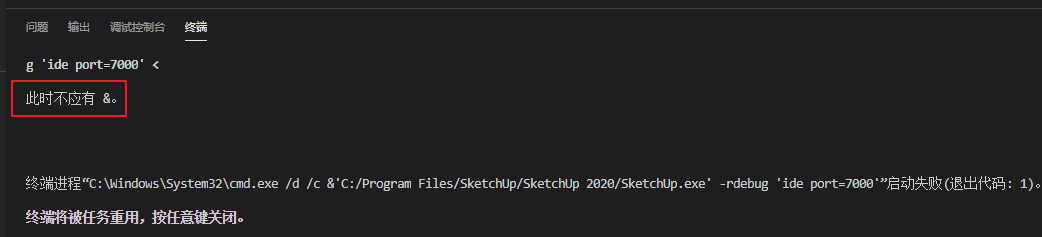
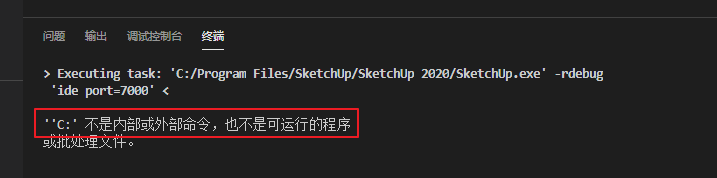
去掉&,就报
‘C:’ 不是内部或外部命令,也不是可运行的程序
于是想了个Workaround:
-
把“C:\Program Files\SketchUp\SketchUp 2020”加到path中去,避免盘符或路径空格引起的问题
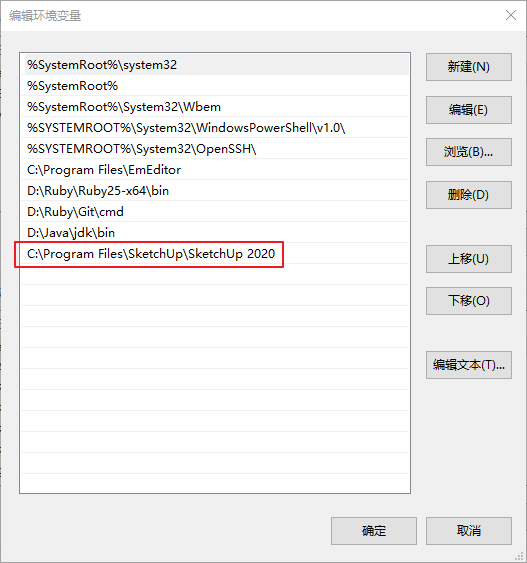
-
用转义字符代替单引号
这样,task.json变为:
{
  // See https://go.microsoft.com/fwlink/?LinkId=733558
  // for the documentation about the tasks.json format
  "version": "2.0.0",
  "tasks": [
    {
      "label": "Debug in SketchUp 2020",
      "type": "shell",
      "command": "", //windows下不需要
      "windows": {
        "command": "SketchUp.exe -rdebug \"ide port=7000\""
      },
      "problemMatcher": []
    }
  ]
}
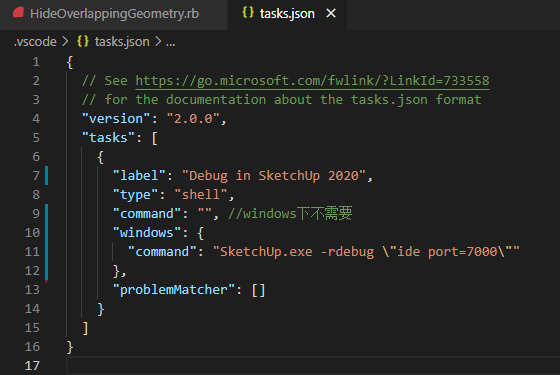
就能成功唤起Sketchup了
二、添加SURubyDebugger.dll
这点在官方文档上是有的,但容易漏掉或搞错。
在sketchup-ruby-debugger的release页面上,下载和自己SU版本对应的SURubyDebugger.dll文件,放到和Sketchup.exe同层的目录下,就可以了。否则无法建立和SU的通讯
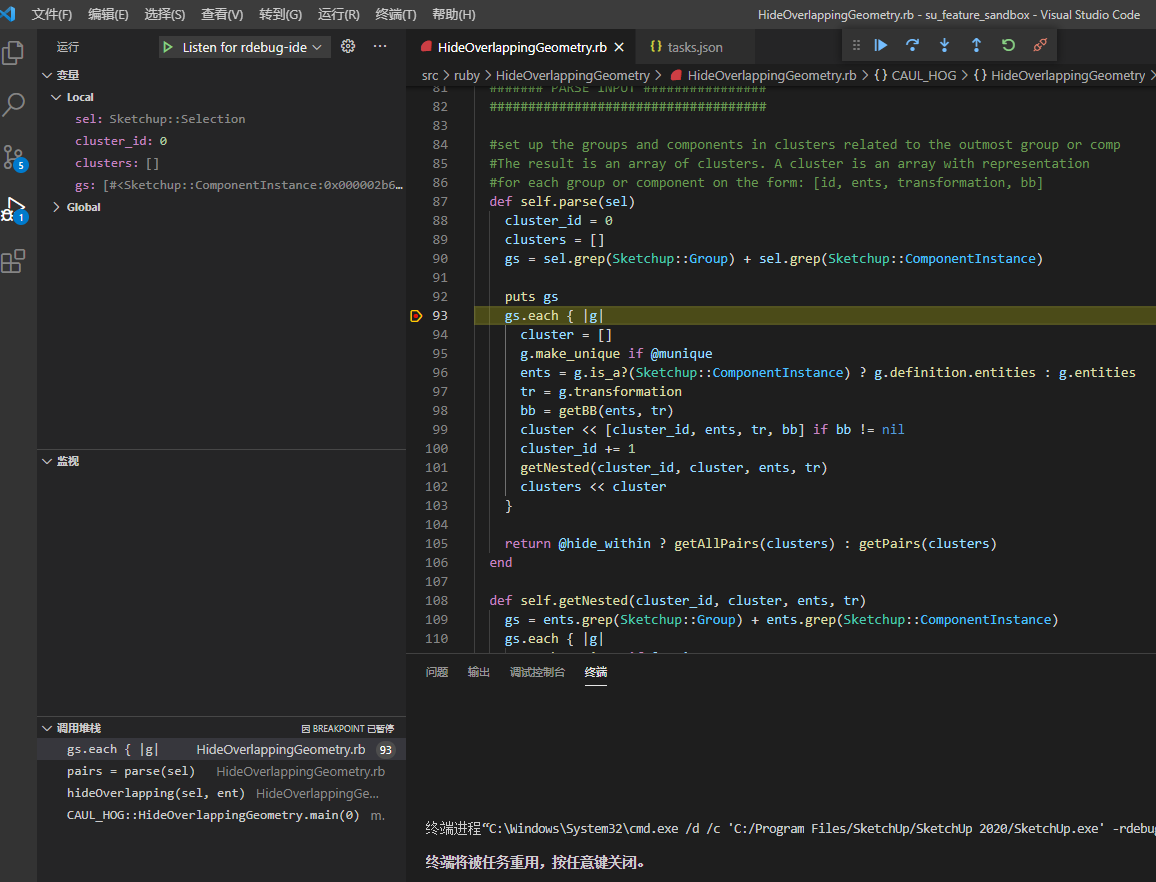
三、进行调试
注意以上两点后,我在本地就能成功debug了
先设置好断点,然后运行Task
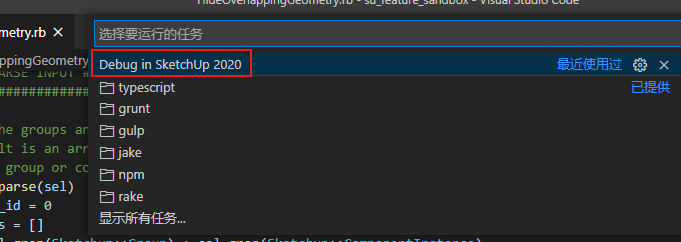
等SU被唤起后,再按F5,就可以debug了